Overview
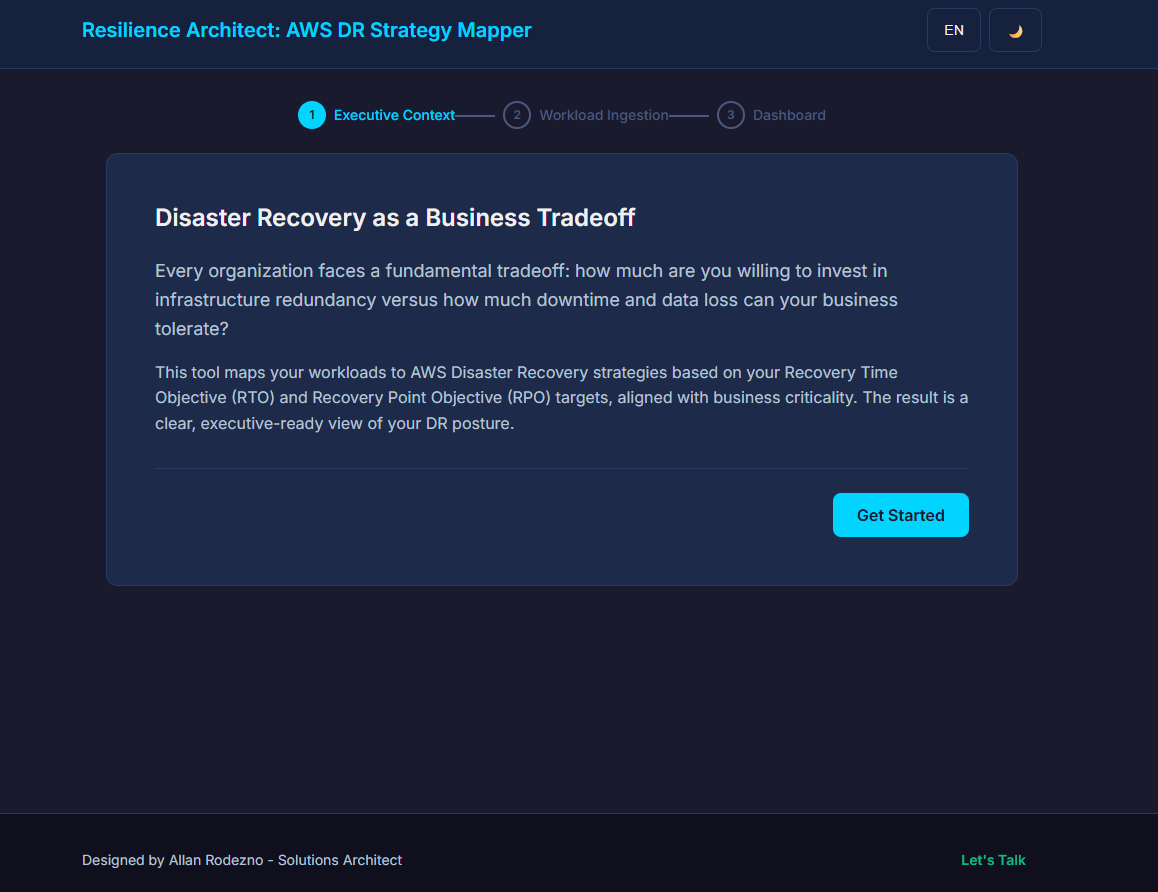
Disaster Recovery planning often stalls at the translation layer — the gap between technical RTO/RPO numbers and executive decision-making. This tool bridges that gap. It takes workload recovery targets and business criticality as inputs, maps them to the four AWS DR strategies defined in official AWS documentation, and outputs a C-suite-ready dashboard with cost-vs-criticality visualizations and actionable tradeoff analysis.
The entire application runs client-side as a Progressive Web App. No backend, no API calls, no data leaving the browser. Sensitive workload information stays in memory and is cleared automatically after PDF export.
The Challenge
The problem isn’t technical complexity — it’s communication. Solutions architects know the difference between Pilot Light and Warm Standby, but executives need to see the cost implications mapped against business criticality before they’ll commit budget. The tool needed to be self-contained, installable on mobile devices, bilingual (EN/ES), and produce a branded deliverable that could be handed directly to a CTO or CFO.
Security was non-negotiable. Enterprise workload data — system names, criticality classifications, recovery targets — cannot be sent to external servers. The architecture had to be 100% client-side with no exceptions.
Architecture
The application is built as a standalone HTML/CSS/JavaScript PWA with ES modules — no build step, no framework, no bundler. This keeps the deployment surface minimal and the attack surface zero.
- Mapping Engine — Pure function that assigns DR strategies based on normalized RTO/RPO thresholds aligned with AWS Prescriptive Guidance. Criticality tier acts as a tiebreaker at boundary values.
- Wizard Flow — Three-step guided interface: Executive Context → Workload Ingestion → Strategy Dashboard
- Visualizations — Chart.js pie chart (strategy distribution) and scatter plot (cost vs. criticality quadrant matrix) with graceful fallback to tables if CDN is unavailable
- PDF Export — html2pdf.js captures the dashboard as a branded A4 report with proper page breaks, then clears all session data
- i18n — Full English/Spanish support with JSON dictionaries and runtime locale switching
- PWA — Service Worker with cache-first strategy enables offline use after first load; manifest.json enables native-like installation on iOS and Android
- Security — All data processed in-memory only. sessionStorage used strictly as a refresh guard. Input sanitization with HTML entity encoding prevents XSS. No localStorage, cookies, or IndexedDB.
Outcome
The tool delivers what a slide deck cannot: an interactive, data-driven conversation about DR investment. Architects can sit with stakeholders, input workloads in real time, and walk through the tradeoff matrix together. The PDF export becomes the artifact that travels up the approval chain — branded, bilingual, and produced without any data ever leaving the room.